Last week I heard the GoodSchist podcast featuring Chris of good schist, Chris of Highly Allochthonous and Julia of The Ethical Paleontologist. That talk featured volcanism among other topics.
Now, OnPoint Radio has a one hour talk on volcanism. Invited guest are Peter Cervelli and Cyrus Read from the Alaska Volcano Observatory, Marianne Guffanti of the U.S Geological Survey and Mark Simons of Seismological Laboratory at Cal Tech. They talk with Tom Ashbrook and callers from all over the U.S. about the recent volcanic activity in Alaska, Chile and Tonga.
Is Bobby Jindal listening?
And here's a video from AP of the Tonga eruption

Monday, March 30, 2009
Univ. Of Florida Geology Dept. Faces Deep Cuts
I'm from Seminole country, rivals of the Florida Gators but this goes beyond football rivalry. Depressing news coming out of the Univ. of Florida. Their geology department is facing deep cuts. The plan is to fire all staff except ten tenure faculty.
That is just a devastation loss to an excellent graduate research and teaching program. From the perspective of my field, Univ. of Florida carbonate geology research group has done some pretty impressive work on Cenozoic carbonate geology of Florida. Pharyngula has an inimitable post on how cuts to graduate departments affect teaching, research and the quality of education. Joseph Meert who is faculty at Univ. of Florida geology department adds his thoughts.
And the Florida Citizen For Science site details just how wrong this decision is given the central role geology departments play in Florida society and economy.
In an era of ‘green technology’, environmental awareness, the need for natural resource management, global climate change and the need to preserve access to freshwater, the thought of decimating a Geology Department borders on insanity. This is especially true of a flagship university that sits about 150 feet above sea level in a state where the top three revenue generators are, in order, tourism, agriculture and mining.
When faced with required budget cuts at a land grant university, is the best solution really to cut one department best poised to address problems directly related to the states three biggest income sources?
I found out recently though that these cuts are not just affecting Universities. The state Dept. of Environmental Protection is also facing severe budget cuts. A friend who is a senior administrator with the Florida Geological Survey tells me that she has had to prepare "survival reports" essentially justifying the existence of the various program areas within the survey.
This one brings it closer to home. I have worked with the Florida Geology Survey for several years and I know friends who could be affected by these looming cuts. One area that has been facing cuts even before the current crises is the coastal geology program.
???? ....Ain't that just a daft idea?
Close to Tallahassee where the survey is located, the Gulf of Mexico coastline with its barrier islands, beaches, coastal wetlands and estuaries is a major player in the state tourism industry. This geological complex is coming under increasing threat from coastal development, hurricanes and in the medium and long term possibly from sea-level rise.
The State of Florida should be strengthening its coastal geology program not thinking of cutting it. It just defies common sense that a knowledge base so crucial to the health and economy of Florida coastal communities is being frozen.
Read this acknowledgment dated October 2008 about the importance of earth sciences and the role it plays in Florida society from the Governor of Florida Charlie Crist. Shouldn't such a strong public acceptance of the importance of geology from the highest political office in the state be followed by a commitment to ensure continuity of funding for university and state geology programs? I see it as a massive violation of public trust for the governor to have signed this document and then to go ahead and butcher geology funding left right and center on the premise that cuts in geology will do the least damage to the University as a whole. That premise is short sighted and faulty but unfortunately it may be a decade or so before the repercussions of this decision are fully realized by Florida society.
Tip: Nanopolitan
Thursday, March 26, 2009
The Power Of An Image- Western Ghat Escarpment
Sometimes an image has the power to stop you in your tracks. I look at images all the time, mostly satellite images, sometimes old aerial photos. A few minutes ago I was mucking around looking for elevation data on India, and tucked in a folder I hadn't browsed for a while was a USGS GTOPO30 DEM. This is a DEM with a horizontal grid spacing of 30 arc second which is about 1 km.
I imported the surface in Manifold GIS. A quick thematic display using the standard Altitude palette, but the result was breathtaking. Below is the western ghat escarpment stretching from north of Mumbai to south of Goa. That's more than 400 km. Its made up of the Deccan basalts along most of the extent of this image but just north of Goa the basalts pinch out and the Precambrian shield region begins.

It goes on for some distance to the south right up to the state of Kerala, but I had to juggle the extent so as to find the right balance between showing it's impressive span but still to be close enough for the sharp topographic divide between the coastal plains and the plateau to come through.
It does so in a marvelous fashion. The darker green coastal plains crash against, almost seem to subduct underneath the long wriggly escarpment, its shadow highlighting the near vertical relief. The local relief is spectacular, more than 1000-1500 feet cliffs and gorges. The escarpment is the edge of an uplifted and east tilted plateau. As a result all the major rivers of peninsular India in this region have easterly drainage. The drainage is antecedent. Post Deccan volcanic but before western ghat uplift. As a result there are meandering gorges and drainage cutting across gentle fold axis.
I was in a hurry to post this. I didn't project the surface, left it in geographic co-ordinates. The scale says 1 deg which is about 110 km at equator.
I travel across the escarpment often. In a car it takes about 20 minutes to an hour to cross depending upon where along its length you are making the crossing. The climatic contrast between the warm humid coastal plains and the dry cooler plateau is noticeable and in summers desirable. You can trek across it too along some pretty demanding trails or try to mountaineer the sheer cliffs.
Now that would be an experience!
It's one of the great geological features I have witnessed and I live about an hour's drive from it.
Wednesday, March 25, 2009
Mapping India Using GeoCommons
Take a look at this great web mapping application. I could plot spatial data about India in a matter of minutes and make a presentable map and then share the results with like minded citizens.
FortiusOne a geographic visualization and location intelligence company has created GeoCommons - a repository for public domain data. It is a free service. You can register as a user and browse through extensive public domain datasets. This you do through a Finder module. You can then select the dataset you are interested in and either
1) download it as a Shapefile or KML (keyhole markup language) format
2) Read details of the data
3) Plot that data on a map with Maker using a background of your choice (satellite, terrain, streetview, solid). You can thematically plot your results using different attributes from the same dataset just like you can in a GIS. But this one is for free.
You can share the results of your mapping by saving them in your account and distributing the link and by downloading the results as a KML file which you can then overlay on Google Earth or Google Maps or Virtual Earth.
Here's the result of a quick experiment that I did with some India data. I picked up the CARMA (Carbon Monitoring for Action) carbon emissions from power plants dataset and made two maps in Maker. The one below shows energy generation by power plant. The size of the dots is proportional to the amount of energy generated by individual power plants. As I mentioned you can download this dataset and get you hands on data you can use and manipulate in more sophisticated spatial analysis software, but most people don't have access to this.

The distribution of mega power plants mostly follow the coal belt. You can see the largest dots are all in the central and eastern part of the country where most of India's coal deposits are situated.
The second map uses the same dataset but plots another attribute, energy intensity. This is the amount of CO2 emitted per unit of electricity generated. It is a measure of energy efficiency.
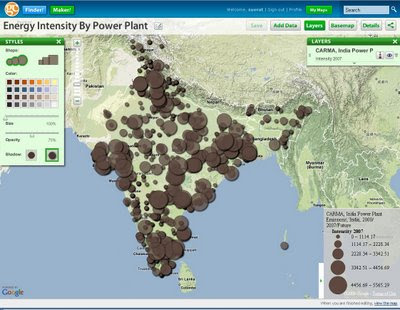
Notice that the energy intensity values in the upper range exceed average values for coal plants in the U.S, which are about 1800-2200 lbs CO2/MWh. The CARMA data I downloaded didn't categorize plants according to fuel burnt. Gas is a cleaner fuel than coal and it's a fair guess that these largest plants are coal fired. Natural gas accounts for just about 10% of power generated in India while coal accounts for about 58%. Indian coal power plants are much more inefficient at generating power than the U.S. The National Action Plan on Climate Change has an Energy Efficiency Mission, i.e. a specific directive to improve energy efficiency. It has its work cut out in the coming years.
Now hold on before you get too excited. The datasets for the U.S are vast but for India you get a very limited stock to work with. Contributions to GeoCommons is voluntary and till date I am guessing very few organizations in India using and creating public domain data know about this site. Most of the data currently available is Census data. Why such a bias? Well, this data is freely available from the Census website (site is under construction). It is stored in a non-spatial tabular format. This data has been pulled out from this site by a user and converted into a geographic format. That's easy to do with the tabular census available with the government.
That's because the data is aggregated by administrative units. If you have already have a base map with state and other administrative boundaries (which is freely available), its easy to just attach this tabular data to the geometric data using the administrative unit name as a key. This is not possible with say natural resources data where boundaries cut across administrative units. This type of data has the geometry stored along with other attributes in a special geographic format. And getting this data from the government is a lengthy process.
So how long before we start seeing more diverse datasets on India in social mapping sites like GeoCommons. That does depend upon how quickly the government implements the National Spatial Data Infrastructure, an initiative to provide easy access to public domain spatial data. Off course the availability of this data has to be coupled with government permission to upload these data onto a third party database. Right now I am not sure if having acquired government data whether you can share it using the kind of distributive model that GeoCommons uses. The rules on this are fuzzy and I really hope the NSDI will bring in some clarification of the governments stance on value addition and data sharing and see an end to the excessively restrictive and regulatory mindset that has limited the innovative use of spatial data in this country.
You don't have to wait until the NSDI takes shape to start contributing your own data to GeoCommons. If you are an organization working with spatial datasets and want to share this data, you can right now upload your data to GeoCommons. When you do so you are agreeing to its free use by others under the Creative Commons license. Anyone will be able to use this data as long as they acknowledge the data creators which is you and the data managers which is GeoCommons.
Social mapping, citizen cartography and a data sharing mechanism to initiate civic discussions on problems that have a spatial angle to them all without an expensive GIS overhead.
Try it out.
Saturday, March 21, 2009
Land Plants And Expression Of Disconformities in Limestone Sequences
Geological Processes and Evolution - 2
A paper in the January issue of Geology looks at the influence of land plants on the detrital sedimentary cycle.
Evidence from Middle Ordovician paleosols for the predominance of alkaline groundwater at the dawn of land plant radiation -
Atmospheric CO2 has decreased by about 500 times from Archean times to recent. So rain water composition has become less acidic over time. But groundwater does not show such a temporal decrease in acidity. In fact groundwater may be more acidic on average in younger geological periods compared with the Archean. This is because of the evolution of land plants by Silurian times which started contributing organic acids to groundwater. The amount of organic acid from the plant system easily offset any decrease in rain water carbonic acid from decreasing atmospheric CO2.
The authors identify a geologic time window - Mid-Late Proterozoic to Late Ordovician when groundwaters were more alkaline than the time period before and after. This is because a) a spurt of continental crust formation by mid-late Proterozoic started consuming CO2 in weathering reactions and b) this stable continental crust provided a substrate for accumulation of carbonate sediments, another important CO2 sink. By early Paleozoic, atmospheric CO2 had dropped compared to the Archean (it was still about 10 times more than the recent ~ 300 ppm). And land plants had not yet evolved.
The paper in Geology demonstrates using the geochemistry of mid-Ordovician paleosols that the groundwater was alkaline in composition. There is some interesting geochemistry for those into such things like element mobility. Other studies in the past have focussed on the detrital composition of sediments and have come to the same conclusions. For example there is an abundance of detrital illite and K feldspar in the mud and sand fractions of early Paleozoic sediments as compared with younger sediments from similar provenance. In acidic groundwater K is mobile and is taken up by chelation into land plants or is transported away in solution. So diagenetic illite is more common in post-Paleozoic sediments.
I have often run into the influence of land plants on sediments from a different perspective, one that involves identification of exposure surfaces in carbonate sequences. Post Silurian during sea-level drops the exposed sea bed will get colonized by land plants. The release of organic acids leads to acidic groundwater and rapid dissolution of the carbonate sediment. Add to that is the physical disruption of sediment by the action of roots and burrowing fauna. All this leads to the development of a highly irregular, pitted surfaces with collapse structures, caverns and infill breccias and a deep chalky weathering profile often with Fe hydroxide stains and crusts. The image below is of a Pleistocene skeletal limestone from a mid shelf facies setting exposed in south Florida for the past several tens of thousands of years.
Notice the karst like profile already developing and penetrating the sequence. If this surface is overlain by sediments in the future the disconformity would be easy to spot in the field.
No such luck in the mid-late Ordovician. Look at this mid-late Ordovician disconformity in the image below. This is the top of a depositional cycle, a parasequence boundary in stratigraphic jargon. The facies setting is similar to the Pleistocene example above.

The climate too has been interpreted to be warm and seasonally moist. The contact just above the coin is an exposure surface. It is a planar surface with a few small pits but overall there is no evidence of the kind of disruptive features you see underneath younger disconformities.
This cycle is part of a cyclic sequence. I could never get a handle on the individual cycle frequency but using regional stratigraphic markers and conodont biostratigraphy a rough estimate is that surface was exposed for tens of thousands of years during Richmondian sea level falls. There is plenty of microscopic evidence of exposure in the form of preserved vadose diagenetic fabrics, but in the field it looks just like a bedding plane. In the late Ordovician there was a land plant cover but it was mostly of the bryophyte grade i.e. mosses and liverworts. These plants don't have disruptive root systems and don't release the massive quantities of organic acids for penetrative weathering profiles to develop.
There are other controls in carbonate systems that can form karstic surfaces in the absence of land plants. One is the facies setting. Supratidal and sabkha facies with dolomite and evaporite minerals dissolve quickly in carbonate under saturated groundwater and these facies often develop the kind of disruptive weathering profiles you associated with a land plant cover.
And the other control is time. Very long lived exposure of limestone, surfaces that are exposed to meteoric condition for tens of millions of years will eventually succumb and form distinctive karst. The image below is of the Knox unconformity between lower Ordovician passive margin platform carbonates and a mid Ordovician foreland basin sequence.
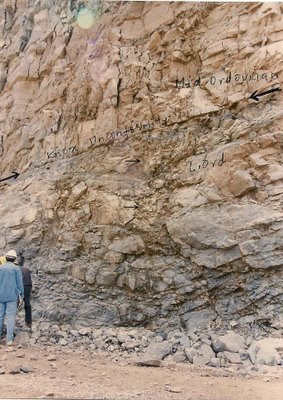
The Knox surface developed during a major sea-level fall that lasted at least 10 million years. A mature karst terrain developed across facies tracts. Sinkhole and caverns fills and intraformational breccias can be seen to depths of 250 m beneath the unconformity.
There have been a couple of recent studies that make connections between evolution and geological processes. One dealt with an increase in diversity in mineral species after the evolution of photosynthesis. The other pointed out a connection between sea water chemistry, evolution of animals and skeletal mineralogy.
Geology may influence evolution. The paper points out that the early radiation of land plants likely took place in alkaline groundwaters. That may explain the affinity for alkali shown by many land plant groups. Subsequently as plant life took hold over terra firma, evolution influenced geology through the transition to acidic groundwater, detrital and diagenetic sediment composition, element mobility and soil composition and characteristics of disconformities.
See: Geological Processes and Evolution
A paper in the January issue of Geology looks at the influence of land plants on the detrital sedimentary cycle.
Evidence from Middle Ordovician paleosols for the predominance of alkaline groundwater at the dawn of land plant radiation -
Atmospheric CO2 has decreased by about 500 times from Archean times to recent. So rain water composition has become less acidic over time. But groundwater does not show such a temporal decrease in acidity. In fact groundwater may be more acidic on average in younger geological periods compared with the Archean. This is because of the evolution of land plants by Silurian times which started contributing organic acids to groundwater. The amount of organic acid from the plant system easily offset any decrease in rain water carbonic acid from decreasing atmospheric CO2.
The authors identify a geologic time window - Mid-Late Proterozoic to Late Ordovician when groundwaters were more alkaline than the time period before and after. This is because a) a spurt of continental crust formation by mid-late Proterozoic started consuming CO2 in weathering reactions and b) this stable continental crust provided a substrate for accumulation of carbonate sediments, another important CO2 sink. By early Paleozoic, atmospheric CO2 had dropped compared to the Archean (it was still about 10 times more than the recent ~ 300 ppm). And land plants had not yet evolved.
The paper in Geology demonstrates using the geochemistry of mid-Ordovician paleosols that the groundwater was alkaline in composition. There is some interesting geochemistry for those into such things like element mobility. Other studies in the past have focussed on the detrital composition of sediments and have come to the same conclusions. For example there is an abundance of detrital illite and K feldspar in the mud and sand fractions of early Paleozoic sediments as compared with younger sediments from similar provenance. In acidic groundwater K is mobile and is taken up by chelation into land plants or is transported away in solution. So diagenetic illite is more common in post-Paleozoic sediments.
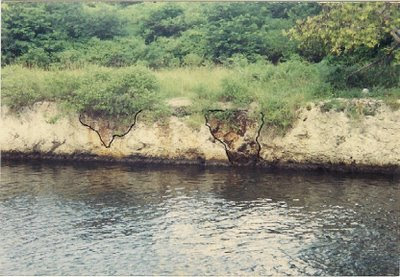
I have often run into the influence of land plants on sediments from a different perspective, one that involves identification of exposure surfaces in carbonate sequences. Post Silurian during sea-level drops the exposed sea bed will get colonized by land plants. The release of organic acids leads to acidic groundwater and rapid dissolution of the carbonate sediment. Add to that is the physical disruption of sediment by the action of roots and burrowing fauna. All this leads to the development of a highly irregular, pitted surfaces with collapse structures, caverns and infill breccias and a deep chalky weathering profile often with Fe hydroxide stains and crusts. The image below is of a Pleistocene skeletal limestone from a mid shelf facies setting exposed in south Florida for the past several tens of thousands of years.

Notice the karst like profile already developing and penetrating the sequence. If this surface is overlain by sediments in the future the disconformity would be easy to spot in the field.
No such luck in the mid-late Ordovician. Look at this mid-late Ordovician disconformity in the image below. This is the top of a depositional cycle, a parasequence boundary in stratigraphic jargon. The facies setting is similar to the Pleistocene example above.

The climate too has been interpreted to be warm and seasonally moist. The contact just above the coin is an exposure surface. It is a planar surface with a few small pits but overall there is no evidence of the kind of disruptive features you see underneath younger disconformities.
This cycle is part of a cyclic sequence. I could never get a handle on the individual cycle frequency but using regional stratigraphic markers and conodont biostratigraphy a rough estimate is that surface was exposed for tens of thousands of years during Richmondian sea level falls. There is plenty of microscopic evidence of exposure in the form of preserved vadose diagenetic fabrics, but in the field it looks just like a bedding plane. In the late Ordovician there was a land plant cover but it was mostly of the bryophyte grade i.e. mosses and liverworts. These plants don't have disruptive root systems and don't release the massive quantities of organic acids for penetrative weathering profiles to develop.
There are other controls in carbonate systems that can form karstic surfaces in the absence of land plants. One is the facies setting. Supratidal and sabkha facies with dolomite and evaporite minerals dissolve quickly in carbonate under saturated groundwater and these facies often develop the kind of disruptive weathering profiles you associated with a land plant cover.
And the other control is time. Very long lived exposure of limestone, surfaces that are exposed to meteoric condition for tens of millions of years will eventually succumb and form distinctive karst. The image below is of the Knox unconformity between lower Ordovician passive margin platform carbonates and a mid Ordovician foreland basin sequence.

The Knox surface developed during a major sea-level fall that lasted at least 10 million years. A mature karst terrain developed across facies tracts. Sinkhole and caverns fills and intraformational breccias can be seen to depths of 250 m beneath the unconformity.
There have been a couple of recent studies that make connections between evolution and geological processes. One dealt with an increase in diversity in mineral species after the evolution of photosynthesis. The other pointed out a connection between sea water chemistry, evolution of animals and skeletal mineralogy.
Geology may influence evolution. The paper points out that the early radiation of land plants likely took place in alkaline groundwaters. That may explain the affinity for alkali shown by many land plant groups. Subsequently as plant life took hold over terra firma, evolution influenced geology through the transition to acidic groundwater, detrital and diagenetic sediment composition, element mobility and soil composition and characteristics of disconformities.
See: Geological Processes and Evolution
Wednesday, March 18, 2009
ISRO Finds New Microorganisms And Hints At Alien Origins
Three new "species" of bacteria have been reported from a sample collected at about 45 km above the earth's surface by a Indian Space Research Organization probe.
ISRO has a press release about this discovery. Here's what caught my eye:
While the present study does not conclusively establish the extra-terrestrial origin of microorganisms, it does provide positive encouragement to continue the work in our quest to explore the origin of life.
What a strange statement to make! Who even made the suggestion that these bacteria could be extra-terrestrials? Why this angle?
Anyways- You're damn right it doesn't establish that ET is here and Excuze Me!! Absolutely nothing about this finding provides positive encouragement to continue work in our quest to explore the origin of life. That field is thriving and cutting edge without these sensationalist gimmicks.
Let's be clear. There is nothing remotely alien about these bacteria. There are certain differences with other terrestrial bacteria, such as a greater resistance to ultra-violet radiation, but the scientists analyzing these bacteria seem to have no trouble placing them phylogenetically or on a family tree of a larger terrestrial bacterial group. That means that these newly found bacteria have a shared evolutionary history with terrestrial bacteria. Alien organisms with no shared history with life on earth will not find a place on our family tree. These are bacteria of earthly origin which have been isolated for some time and have diverged somewhat from their land-bound cousins.
How has science reporting gone so far off the track here in India? That a report of bacteria found in the atmosphere leads to the inevitable suggestion of alien origins?
But off course the fact that a statement like this was made reveals the motives behind this experiment and that is to test the late Sir Fred Hoyle and his student Prof. Jayant Narlikar's pet theory that life on earth was seeded by ....well... life from outer space. ISRO has not couched it in these terms, but the principal investigator of this project is ... Prof. Jayant Narlikar.
Panspermia.
Now, the possibility that organic molecules were showered on earth by comets is taken seriously by many scientists, but Hoyle and Narlikar think that bacteria, that is fully formed cellular complex life rode on the backs of comets and seeded the earth. The problem is that finding bacteria in the stratosphere which are genetically nearly identical to terrestrial bacteria does nothing to test this theory. It doesn't show that these bacteria or indeed life came to planet earth from a comet source. For that you would have to find bacteria preserved on cometary bodies and compare them with bacteria on earth and establish ancestry. But so far these heavenly bodies have been found not to contain any living material in them. Isn't it more likely that the ancestor of these stratosphere bacteria got up there from down below here and then differentiated somewhat?
That is the reason why scientists could phylogenetically classify them. There is a family relationship between these new "species" and known species on earth.
But understanding common descent and evolution was never Prof. Narlikar's forte. He once proposed that the SARS virus originated in outer space just like these violet bacteria.
The original theory of panspermia claimed that life on earth was seeded by comets and meteorites bringing life-forms from outer space. But Narlikar believes that those heavenly bodies have been raining death on this planet as well.
The brain dead Indian media encouraged by Prof. Narlikar has given front page space to this "extra-terrestrial origin of bacteria" angle. Times of India carried an interview yesterday I think which is not yet online. But I don't trust anything Prof. Narlikar says about biology.
Neither should the media. But here in India if a senior scientist makes a claim then ...well then
how can we question your expertise in biology and evolution or any other topic on this planet even though you are an astrophysicist when you are so senior most respected most learned sir...
But you should question- and not let people get away with nonsense.
Monday, March 16, 2009
Keeping Track of Samples During Field Work
Rummaging through drawers this Sunday I came across some old field photos. I did very focussed sampling of outcrops during my Ph.D. research on mid-late Ordovician carbonates. This was because I was interested in finding out how far below the preserved cycle top does meteoric diagenesis penetrate. How thick were the meteoric lenses that developed during sea-level falls? This was linked to bigger questions like climate change induced sea-level fluctuations, the changes in amplitude in sea-level if any from a mid-Ordovician greenhouse to a late Ordovician icehouse, and the control of basin geometry and stratigraphic architecture on movement of fluids. But the first step was to generate the basic data and sample the outcrop at about 4-6 inch intervals.
That meant I had to keep an accurate record of where exactly on the outcrop any particular sample came from. I was going to just sketch the outcrop was best as I could, but my adviser suggested I borrow his Polaroid camera. That worked out quite well. I could take a picture, put the photo print in my pocket for a few minutes to develop the image and annotate on it. I have some images below of annotated outcrops. These don't show completed annotation. For example they don't have sample numbers placed besides the dots. Eventually, I ended up with a consistent numbering scheme. Cycles present in the outcrop were numbered from bottom to top in ascending order and the samples within each cycle were numbered from bottom to top in ascending order.


I sketched the outcrop too. I found it useful to just slow down my work flow, sit in front of the outcrop and draw. I wasn't too interested in analysis of sedimentary structures, but it helped me think of basin stratigraphy and the cycle stacking patterns in front of me. And I took photos from a regular camera, my trusty Minolta 700 (my research as you might have guessed was in the pre-digital camera epoch). I used one of those dual purpose films. That meant I could develop slides for presentations and regular prints to slap onto my thesis from the same film. Those I sent to a lab in Seattle to develop. Overall this three pronged approach to representing the outcrop and tracking samples worked out quite good.
Any of you geobloggers use a Polaroid camera? If you are doing very focussed sampling, how do you mark the location of your sample? Sketching is one way to go about it, but is there a combination of a digital camera and a field laptop that might be used productively and efficiently? Aerial photos or high res satellite image might work if your sampling intervals are wider apart and the outcrop is illuminated and is not a vertical cut. Any other method?
My Polaroid became quite well know to the state troopers patrolling Interstate 59, Interstate 75 and the many state and county routes in northern Alabama, Georgia and southern Tennessee. I guess I was a strange sight standing along road cuts with my two cameras, a sledgehammer and a row of labeled zip lock bags with my samples in them. The police used to pull up and politely ask me what I was doing. I used to launch into a lecture on diagenesis but with a nod they would leave. I guess they weren't interested in geology, but they were kind enough never to interfere with my work.
Tuesday, March 10, 2009
An Evolutionary Arms Race
Check out this great video. I wrote about the Red Queen hypothesis some time back, which explains why species that have been around for a while have the same probability of extinction as newly evolved species. Coevolution and arms races are integral to understanding this pattern of extinction.
Here's a take on it:
Tip: Laelaps
Here's a take on it:
Tip: Laelaps
Saturday, March 7, 2009

Thursday, March 5, 2009
Indian Space Org Not In Competition With Google
It's official. The Indian Space Research Organization's imaging service Bhuvan is not in competition with Google Earth. And the launch of this service is being delayed from March to who knows when.
Livemint.com has an article by K. Raghu on Bhuvan with quotes from ISRO officials about what the service will offer users. In my earlier post on Bhuvan I had asked 4 questions about the service. We now have answers for some of them
My questions were:
1) Will the images from Bhuvan be superior to that provided by Google? - The answer to that hasn't changed. No they will not be superior at least for urban areas. Google and Bhuvan both have the capability of covering rural areas with high resolution imagery. Google currently does not cover rural areas in India with high resolution images, but that could change if they perceive a threat from Bhuvan.
2) Will ISRO make other data available? - Yes they will, but the details of the layers which you can overlay on the images are not known. In fact getting these layers available and in a format required by Bhuvan seems to be one of the reasons behind the launch delay.
3) Will Bhuvan be like Google Maps or like Google Earth? - It will be like Google Maps. I wrote about the difference between these two products. In short, Google Maps is a true web mapping service. The interface as well as the data is sent to the user from a remote server. Google Earth is not a true web mapping service. You have to download the software and run it from your local computer. Only the data is being sent to you from a remote server. This enables the highly sophisticated interface to function efficiently.
Bhuvan will not be a download like Google Earth. It will be a standard web enabled GIS just like hundreds of other web mapping applications. The novelty will be that it will use image data exclusively from Indian satellites. Maybe that's what the hype was about. In any case as far as image quality goes, the hype although a little misdirected is well deserved. The Indian remote sensing program has been a credit to the nation and I am glad that Bhuvan will expose this imagery to users beyond a small group of professionals.
After this clarification from ISRO about what the product is, it's time our media stops calling it a Google Earth Killer or a product that is going to compete with Google Earth or a product which is a variant of Google Earth. There is no need for Bhuvan to compete with Google Earth. It can be a very useful service on its own terms in the Indian context.
4) Will ISRO allow open access to the Bhuvan API? - ISRO has not clarified it's position on this yet. But very unlikely.
I play a role in this article too. A couple of days ago I answered some questions posed by the Livemint.com reporter K. Raghu on Bhuvan. I have been quoted:
Others such as Suvret Kher, an independent geographical information system expert, advocate opening of APIs would help people to embed Bhuvan in their own customized applications and overlay their own data, making for a more effective use of the product. “That is one way to popularize the use of the imagery,” he said.
Suvrat- please!!
The article perpetuated another misconception about images and how they represent the earth.
These satellites shoot images as small as a car on the street, to build a three-dimensional map of the world.
Wrong. You can't build a three-dimensional map of the world using only high quality satellite images. The satellite image has no information of elevation associated with it. You can interpret that an area has relief by the tonal variations but no actual Z dimension is encoded in the image data. For that you need a relief representation of the world known as a Digital Elevation Model or DEM. It's this model of the relief that gives you information about the elevation or the third dimension. You can then overlay or drape an image or any other data on this DEM - which can be graphically turned into a shaded wrinkled layer in the map viewer- and get a feel for the topography. Google Earth offers this 3D viewing with an additional tilt option.
Again, unless ISRO comes out with a list of layers on offer we won't know if terrain viewing in 3D is going to be part of the bouquet of services. As I mentioned in my earlier preview, the more functionality you add to a web mapping service the slower and more unwieldy it is likely to become. That ought to be a big limitation in making Bhuvan too complex, considering the poor bandwidth available to most Indian users.
This post series will follow developments of Bhuvan and the spatial data landscape of India as and when they happen. So, keep coming back.
Monday, March 2, 2009
Ancient Homo Leaves "Modern" Footprints
This has been covered by a lot of news agencies. I got my first look at these ancient human footprints found in Ileret, Kenya from my Economist.com sci/tech feed.

Credit: Brian Richmond/George Washington University
They look human and the research done using detailed measurements of the depressions and swells that are left when a foot presses on soft mud indicates that the creature walked pretty much like we do. Or at least they are very different from the Laetoli footprints found in Tanzania and interpreted to be made by a member of the Australopethicines about 3.75 million years ago. Those footprints suggested a gait that was more ape like. This one seems a more heel to toe style of walking closer to us recent humans. The sediment has been dated to about 1.5 million years old. The footprints indicate a stature and body mass consistent with Homo erectus.
I just wanted to point out something about the tempo of human evolution. In the figure below which shows the changes in cranial capacity seen in the human lineage I have marked the appearance of the modern bipedal gait as suggested by this study to compare the timing of its first appearance with the trend in the evolution of brain size.
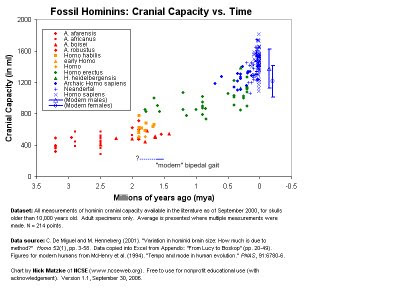 Original Source: Nick Matzke
Our modern style of walking appeared well before our brain size reached modern proportions. This shows nicely one of the more important principles of evolution, that different traits within a lineage often evolve at different rates.
The collection of traits - anatomical and behavioral - that define us "modern" humans evolved over a long period of time ... out of step with each other (no pun intended!), the modern style of bipedalism preceding an increase in brain size to the present proportions by more than a million years.
So, there never was any one instance during our evolution when we can say we became modern humans.
When thinking about evolution I don't like the term "modern" humans. It has a teleological feel to it, that somehow evolution was directed towards building us. People use the term to mean that evolution is something that changed our ancestors in the remote past and that once all the pieces of anatomy and behavior feel in place in the Pleistocene, we Holocene "modern" humans haven't changed at all. It's those ancestors of ours who walked funny and could not talk or create art. There is a finality with which we seem to see ourselves.
Now that is simply not true. There is a growing body of evidence most recently compiled in a book by Gregory Cochran and Henry Harpending " The 10,000 Year Explosion" that suggest that the pace of human evolution since the advent of agriculture has in fact quickened.
One million years from now if our species still exists, our descendants will look back to us as an ancient form of human, a population "intermediate" between Homo erectus and themselves - Homo sapien syntheticus? - Evolution has changed us and will continue to do so in ways we cannot entirely predict.
Maybe thinking ourselves as "modern" just reflects our inability to anticipate what we might become in the future.
Subscribe to:
Posts (Atom)