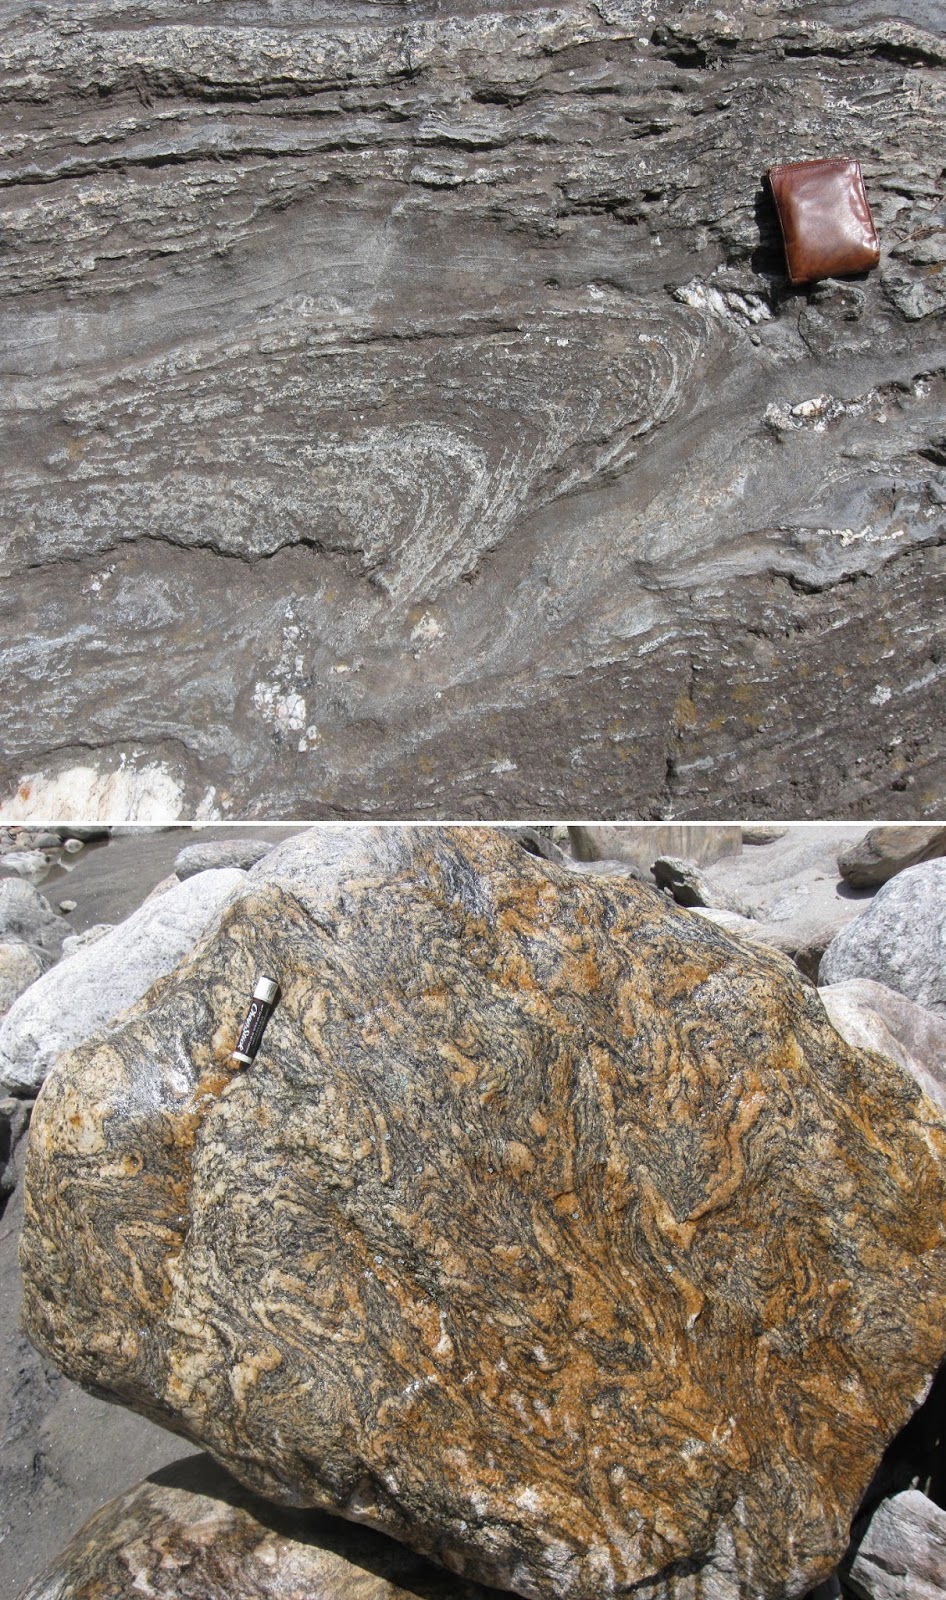
A lot of ink has been spent of this topic, both in the scientific literature as well as in popular books about the Harappan Civilization. The focus of many of these efforts has been on locating the "Vedic Saraswati", a river mentioned in the Rig -Ved. It is described as occupying the region between the Yamuna and the Sutlej and has been identified by many workers as the present day Ghaggar-Hakra.
Settlements of the Harappan Civilization were spread out over quite a large area in northwest India. Hence, it is necessary to map in detail the broader once existing hydrologic networks to assess the relationship between settlements and patterns of water availability and water use. This study uses remote sensing data and image processing techniques to unearth some of the buried paleo-river networks of this region of northwest India.
Twenty eight years of Landsat 5 imagery totaling 1711 multi-spectral images was bulk processed. This use of data covering multiple dates in a year allowed the investigators to reduce visibility issues related to shifting land use and cultivation, changing moisture patterns and variable cloud cover. 8000 km of paleo-river channels were mapped, some identified in previous studies, but many recognized anew.
The paper describes the various image processing techniques used to tease out the spectral signatures of the buried rivers. Don't be alarmed by words like Normalized Difference Vegetation Seasonality Index (NDVSI), Principal Component Analysis and the Tasselled Cap Transform. One can understand the final interpretations without getting into the details of these techniques. Let me give a brief idea though.
These are techniques has increase the contrast between vegetation, soils with different moisture levels and bare terrain. For example, due to stronger water flow the river channel itself and the levees it builds contain coarser sediment as compared with the adjoining floodplains. These coarser sediment contain less organic matter and are less fertile. Less vegetation grows on the buried channels and levees than on the more fertile fine grained floodplain sediment. This contrast shows up well on data processed using NDVSI which essentially maps the vigor of vegetation. This technique was useful in delineating channels in the northern part of the study area.
The southeast part of the study area is more arid and has less changes in vegetation across the landscape. Here, the Tasselled Cap Transform was more useful in identifying river channels. This techniques organizes the spectral information into several (usually three) main axis or bands of information. One axis contains data variability of reflectance of bare terrain (mineral mixtures). The second contains variability in greeness (vegetation), and the third contains variability of wetness (water and soil moisture). Again, to give an example, this southeast region is fed by rivers draining Aravalli limestones. The calcium carbonate leached away from the rock is precipitated along river channels as a chalky mineral deposit. Buried channels show up as ribbons of bright reflectance in the Tasseled Cap Transform brightness band. Imagery of the dry months shows these channels more clearly, since in the wet months, increased soil moisture reduces the contrast of calcium carbonate rich sediment.
A judicious use of such techniques thus enabled the researchers to identify buried networks with different vegetation, soil moisture and mineral brightness properties.
A map of the interpreted buried rivers is posted below.
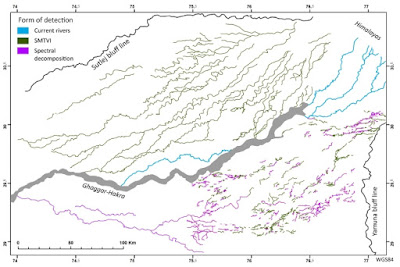
Source: Hector A. Orengo and Cameron A. Petrie 2017
Of importance is a critique of some previous studies which attempted to highlight the spatial relationship between river channels and archaeological sites (emphasis mine):
The data provided by these analyses are also important in contextualising previous studies in which palaeo-rivers have been dated using the distribution of known archaeological sites. Notwithstanding the positional accuracy of these locations (see [10,63,64]), which would severely hamper their use for validation purposes, the results for the northern sector of the study area (Figure 3) suggest that proximity to the river might not be a good indication of contemporaneity as the fields close to the river channel might not have been the most productive in agricultural terms. Sites with an agricultural orientation might have preferred to occupy elevations above flooding level in the finer sediment accumulation area. Flooding events and changing river courses could also have had an important effect in the preservation of archaeological sites eroding and burying those that were locatedin the path of new courses or in their sediment accumulation areas.
In addition to these factors, the scale at which these correlations between specific palaeo-channels and settlement locations have usually been published (e.g., [30] (pp. 359–387), [31] (Figure 4.2)]) do not allow the accurate correlation between the two elements. The use of large area (small scale in a geographic sense) site distribution maps for these correlations results in a visual association between the shape of the palaeo-river and the line formed by the grouping of sites, but at these scales the sites could be aligned to a number of palaeo-channels given the number of rivers and the parallel morphology of the drainage in the Sutlej-Yamuna interfluve revealed here. This analysis thus suggests that at these scales it is not possible to co-relate lineal distribution of archaeological sites to any particular palaeo-river that we have documented. The results from previous studies reconstructing the chronology of the hydrological system using the position of archaeological sites and vice versa(e.g., [24,25], [30] (pp. 359–384), and [31]) are, therefore, considered unreliable.
..and
Given the complexity of the hydrological system, the variety in the climatic and weather system of this region, and the diversity of ways that ancient populations are likely to have obtained water, it is unwise to use the date of occupation at specific settlements to date when specific channels carried water. It is essential to date the different palaeo-courses independently to properly reconstruct the evolution of hydrological networks over long periods. The chronologically consistent reconstruction of this palaeo-river network would allow the testing of different hypothetical scenarios of water availability through the use of network analysis in combination to hydrological analysis.
Interesting work. Open Access.